Hi,
Some info. I didn't notice before, but OWS if sending a 'simple' HEAD, while JWS if sending a HEAD with "If-Modified-Since".
The result is different : OWS gets some info about the resources and an HTTP 200 - OK , while JWS gets a laconic HTTP 304 : "Not Modified" (and that's indeed only what we need.
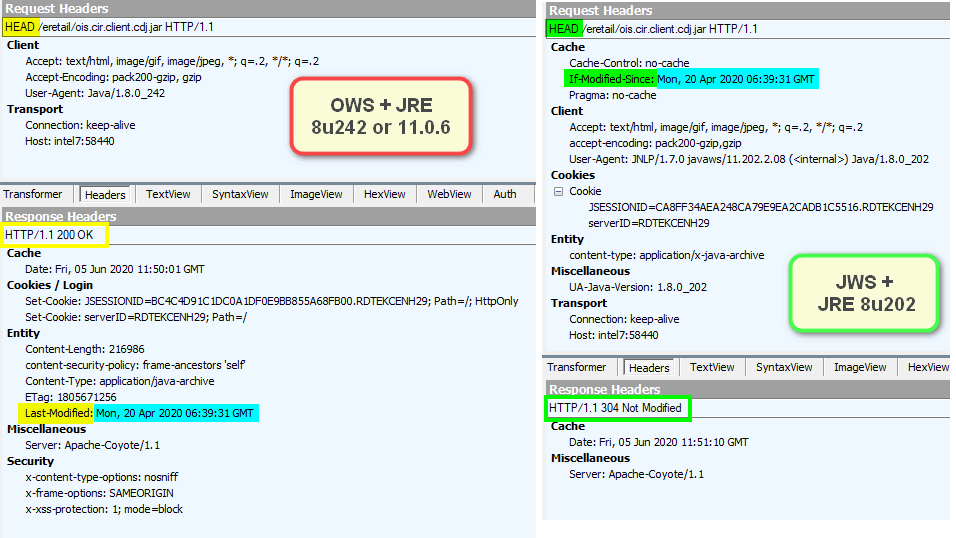
Also, but that's maybe not important, for each resource checked, OWS is not sending any the JSESSIONID cookie that is set on *each* reply.
For JWS, after the 1st or 2nd reply (so 3-4 HEAD are still on the way), all the nexts HEAD will have a given JSESSIOND set.
That probably no a big deal, as the server (it's the same), is always answering fast (creation a JSESSIONID is fast).
=========================
About the 3.0.0alpha, that's strange but with the same jnlp used previously (indeed sent back with application/x-java-jnlp-file MIME) I get that error:
Code: Select all
net.sourceforge.jnlp.LaunchException: Fatal: Read Error: Could not read or parse the JNLP file ...
....
Caused by: java.lang.RuntimeException: java.lang.IllegalStateException: Could not locate a suitable JRE description in the JNLP file for the underlying execution environment. The system properties detected are as follows: (locale: en_US, OS: Windows 10, OS arch: amd64, Java version: 1.8.0_242)
In jnlp, j2se version is "11+" . That is working with 1.1.7. Tried 11.0* , 11*, 11.0+. the same.
What is working : 1.8+ !? (<== and that's only at that time that AdopOpenJDK 11.0.6 was loaded. Set as prefered vendor)
There's this warning :
Code: Select all
- your JRE - 1.8.0_242 - does not match requested JRE - 11+
with the "non working" j2SE version...
============================
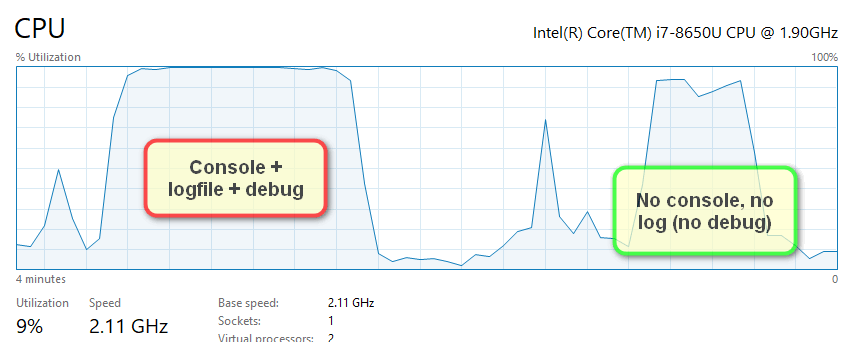
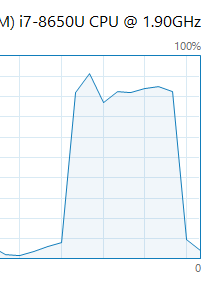
As I'm testing in VM, I've made a counter test to exclude the VM impact. On the same VM as 3.0.0alpha (registered with only jnlpx), I've installed Oracle JRE 8u202, save the jnlpx as jnlp and ... I confirm the start of the cached application in 2.5 seconds with JWS... while 3.0.0alpha is taking around 40sec (with *FULL* log and console displayed) ... but "ONLY" 10 seconds with no log and console disabled (and 22 sec with console displayed but no log):
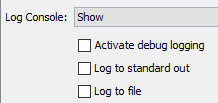
Final users needn't to have the console displayed, but log / console looks to have a real impact..
Indeed the great flow of logs in console reminds me I used to shrink DOS windows that have to display much data ... to avoid as many refresh of screen as possible and speed up transfer for example. I've made the test here. As soon as the console windows are displayed, I reduce their height. The loading drop from 22 to 17 sec...
uhm ...wait... is display (and especially moving down logs in a window) so important.
==> In the VM settings, I checked "Accelerated 3D Graphics" and made another test ==> 16 seconds with consoles and full log (9 without).
===============
Summary:
1) Log and console if activated, consume some CPU and could slow down loading (and maybe operation in general) during log scroll down, particularly if some hardware speedup is not set (where's the 3D here BTW

????).
==> Suggested possible easy workaround : be able to choose if message are displayed by default on console opening (checkbox "Show message")
If you're interested in logs... *then* you display them when needed ?!
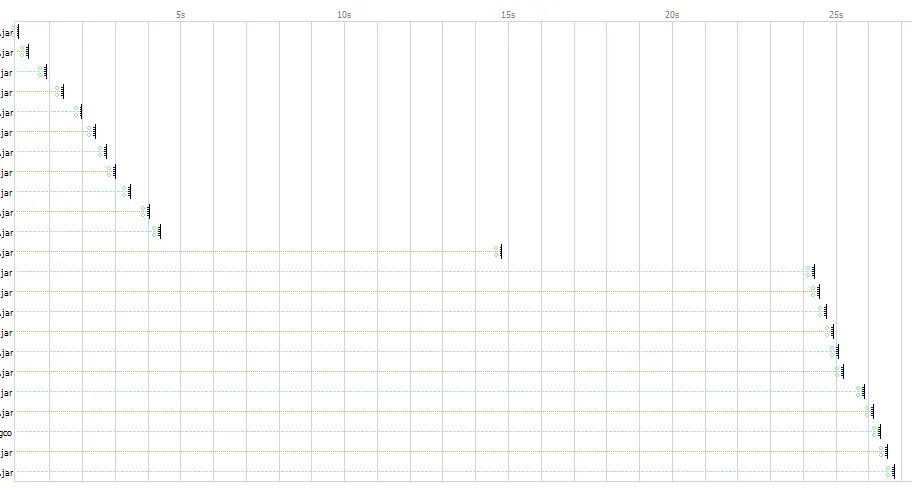
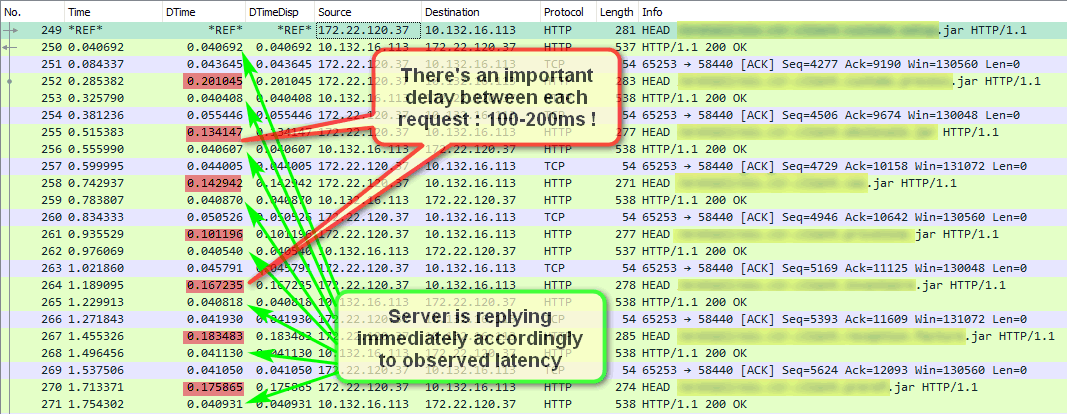
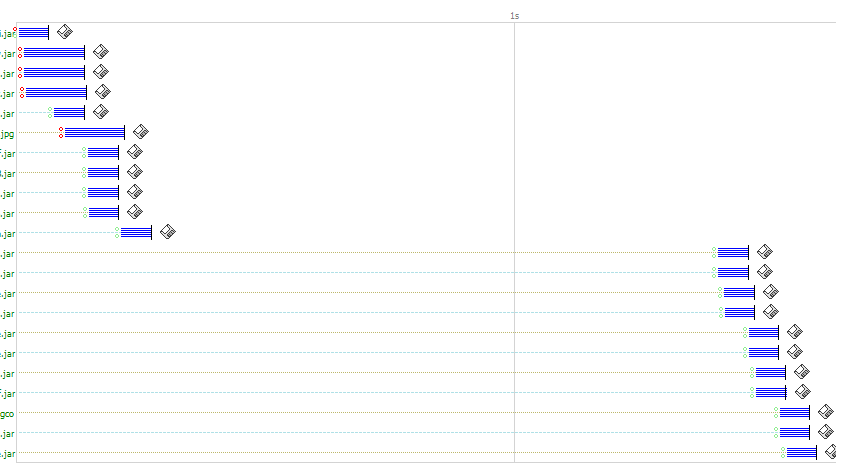
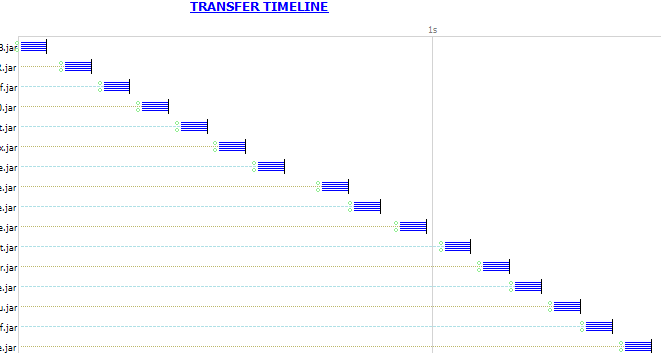
2) There still the use of a single connection (?!) to load sequencialy the jars/ressources.
With the display speedup "improvement"

, the time between the reply and the next request is now 25-35ms (it's 5-15 ms for JWS). So that's OK
Yeah, CPU problem was on my side...